The whole process of profiling an application is an attempt to identify hotspots within the application which consumes more resources or takes too much time - knowing this would allow us to identify how to further improve the code within the applications that we build in order to build applications that consume less resources or would respond better to external inputs. Profiling of an application is just another aspect to improve observability of application’s performance on top of the common usual tooling such as distributed traces, metrics and logs. Tools such as distributed traces, metrics and logs only can capture part of the picture of how an application performs within an environment but is different for profiling. Profiling would point out what is happening “internally” within the application such as amount of memory being allocated for particular functions, how much CPU time is being taken for a particular function, thereby providing even more visiblity to how the application works.
Unfortunately, I don’t work in this performance analysis space too much so I don’t fully understand the various tools that can help with this but I do know that within the Golang programming language, one can utilize a tool called PProf to do the “profiling” of the application as mentioned above. Generally, these profiles are generally collected as a one-off - usually being obtained when “stuff” happens in production; e.g. application crashes or application being unresponsive for certain endpoints etc. However, seeing that such information is collection as one-off pieces of data, we as engineers could easily miss the moment of the most “ideal” time to collect such information which would be able to help us debug the situation much more easily. Imagine if we could have a tool that could do it continuously on our behalf…
Within the Google Cloud suite of items, there is a product called Cloud Profiler - which essentially attempts to capture the status of applications at different points of when an application is running. However, this tool mostly operates within the Google Cloud ecosystem - unfortunately, not every company/everybody operates within that space - so, it would be better if there was something in the open source community that would somewhat cover this need (I guess something similar to Prometheus + Grafana to Google Cloud’s monitoring/metrics vizualization system). If only there is a somewhat similar tool out there in the open source space.
Luckily there is, and that tool’s name is Pyroscope. Refer to the following product page for details on it as well as its documentation
Rather than going through the benefits of the tool and its various use cases etc (which you can find on the product/documentation pages), this post would focus more on the experience of getting the thing to work on Kubernetes (in particular, GKE but I suppose it’ll probably work on other Kubernetes distributions as well)
There are a few things to do up before we can finally demonstrate the possibility of this working
Setting the environment on Kubernetes cluster #
This is considered one of the “complex” bit as it involves a lot of moving pieces. However, take into mind that the approach that is being used here is a bit on the “exploratory” side since we even attempt to deploy components that one would assume is available in public cloud (e.g. object storage etc)
Refer to the following folder within that same repo: https://github.com/hairizuanbinnoorazman/Go_Programming/tree/master/Environment/kubernetes
The setup is still somewhat unstable (it still fails once in a while and there is a need to step in to manually correct the setup to get everything up and running). However, I do intend to eventually get to a state where this environment can be fully setup without any issues.
The first command to run from this folder is the make cluster command. This would use gcloud command to create a GKE standard cluster on the account that is registered with the gcloud command. This post will not cover of how to set up Gcloud with the relevant credentials. Refer to the following page for how to do this: https://cloud.google.com/sdk/docs/initializing
Next step would be to ensure that all helm repos are setup (and we’re gonna be installing a lot of helm charts across many helm repos). Run the make environment to do so. Ensure that helm 3 is already used on where this command is running from.
I suppose the last step to set all “observability” tools including pyroscope would be the make observability command which would install the following:
- Prometheus (For scrapping metric information from apps)
- Minio (Open source object storage - still experimenting to operate it)
- Loki (Log collection tool)
- Promtail (Tool to retrieve logs from kubernetes workloads and push it to Loki (or equivalent))
- Pyroscope (Continuous Profiling tool)
- Tempo (Distributed Tracing tool)
- Grafana (Vizualization tool)
If all goes well, the command would run without issue and we can have our entire observability stack running with Pyroscope included in it as well.
In order to make it easier to add new applications to have their pprof profiles to be retrieved as well, it would be best to do it without static configurations. We can setup scrape configurations to have Pyroscope to check against Kubernetes API to see pods with particular annotations and then have Pyroscope scrape pprof profiles of the pods.
For the scrape configurations:
(Do not rely too much on this code snippet - when the Pyroscope tool change, the configuration might not work anywhere)
rbac:
  create: true
pyroscopeConfigs:
  log-level: debug
  scrape-configs:
    # Example scrape config for pods
    #
    # The relabeling allows the actual pod scrape endpoint to be configured via the
    # following annotations:
    #
    # * `pyroscope.io/scrape`: Only scrape pods that have a value of `true`.
    # * `pyroscope.io/application-name`: Name of the application being profiled.
    # * `pyroscope.io/scheme`: If the metrics endpoint is secured then you will need
    # to set this to `https` & most likely set the `tls_config` of the scrape config.
    # * `pyroscope.io/port`: Scrape the pod on the indicated port.
    # * `pyroscope.io/profile-{profile_name}-path`: Specifies URL path exposing pprof profile.
    # * `pyroscope.io/profile-{profile_name}-param-{param_key}`: Overrides scrape URL parameters.
    #
    # Kubernetes labels will be added as Pyroscope labels on metrics via the
    # `labelmap` relabeling action.
    - job-name: 'kubernetes-pods'
      enabled-profiles: [cpu, mem]
      kubernetes-sd-configs:
        - role: pod
      relabel-configs:
        - source-labels: [__meta_kubernetes_pod_annotation_pyroscope_io_scrape]
          action: keep
          regex: true
        - source-labels:
            [__meta_kubernetes_pod_annotation_pyroscope_io_application_name]
          action: replace
          target-label: __name__
        - source-labels:
            [__meta_kubernetes_pod_annotation_pyroscope_io_spy_name]
          action: replace
          target-label: __spy_name__
        - source-labels: [__meta_kubernetes_pod_annotation_pyroscope_io_scheme]
          action: replace
          regex: (https?)
          target-label: __scheme__
        - source-labels:
            [__address__, __meta_kubernetes_pod_annotation_pyroscope_io_port]
          action: replace
          regex: ([^:]+)(?::\d+)?;(\d+)
          replacement: $1:$2
          target-label: __address__
        - action: labelmap
          regex: __meta_kubernetes_pod_label_(.+)
        - source-labels: [__meta_kubernetes_namespace]
          action: replace
          target-label: kubernetes_namespace
        - source-labels: [__meta_kubernetes_pod_name]
          action: replace
          target-label: kubernetes_pod_name
        - source-labels: [__meta_kubernetes_pod_phase]
          regex: Pending|Succeeded|Failed|Completed
          action: drop
        - action: labelmap
          regex: __meta_kubernetes_pod_annotation_pyroscope_io_profile_(.+)
          replacement: __profile_$1
This was reference based on what was mentioned on the Pyroscope docs website: https://github.com/pyroscope-io/pyroscope/tree/main/examples/golang-pull/kubernetes
Within the deploy.yaml file - you can probably notice this:
...// Within the deployment spec
  template:
    metadata:
      labels:
        run: app3
      annotations:
        pyroscope.io/scrape: 'true'
        pyroscope.io/application-name: 'app3'
        pyroscope.io/profile-cpu-enabled: 'true'
        pyroscope.io/profile-mem-enabled: 'true'
        pyroscope.io/port: '8080'
    spec:
      containers:
        - image: full-observability:v5
...
Application with Pprof endpoints available #
First part is that we would need to have an application that is able to present pprof details externally. This can be somewhat easy to do with various examples available on the web - the pprof golang package provides handlers that can be used to provide all debug pprof endpoints that covers the entire list of profiles to debug - e.g. CPU, Heap, Goroutines etc.
However, in the case where one already have an endpoint in use (could be because the application is a web server), we can just create just debug endpoints that would be additionally served on our web server api endpoint.
	r := mux.NewRouter()
	r.HandleFunc("/", handler)
	r.Handle("/healthz", StatusHandler{StatusType: "healthz"})
	r.Handle("/readyz", StatusHandler{StatusType: "readyz"})
	r.Handle("/metrics", promhttp.Handler())

	// Profiling endpoints
	r.HandleFunc("/debug/pprof/", pprof.Index)
	r.Handle("/debug/pprof/allocs", pprof.Handler("allocs"))
	r.Handle("/debug/pprof/goroutine", pprof.Handler("goroutine"))
	r.Handle("/debug/pprof/heap", pprof.Handler("heap"))
	r.Handle("/debug/pprof/mutex", pprof.Handler("mutex"))
	r.HandleFunc("/debug/pprof/profile", pprof.Profile)
All of the above pprof endpoints are also served via the same port - which in the case of this application’s example - it would be port 8080.
We can test that the profiles can be obtained by running ti locally and hitting the debug pprof endpoints and it should allow us to download the profiles. If we wish to vizualize the gathered profiles, we can attempt to do so via the following:
go tool pprof -http=localhost:8500 http://localhost:8080/debug/pprof/heapThe application would be deployed to kubernetes cluster which is why you would see a deploy.yaml manifest with a kustomize.yaml file along side it to accomodate cases where we need to alter all the values of images in the deployment spec of the deploy.yaml file. However, to capture the profiles (as well as other debugging information), we would need to setup all the relevant tooling for it.
In order to get the the application above to deploy, we would need to first build the docker image for this. This can be done via docker build -t gcr.io/<project id>/full-observability:0.0.1.
Next would be to push it to a container registry. In the case of this project, we would be pushing it to Google Container Registry and that can be done via docker push gcr.io/<project id>/full-observability:0.0.1. Don’t forget to set up the credentials for this by following this: https://cloud.google.com/container-registry/docs/advanced-authentication
The next step is to actually run the application - it will the same container with 3 different names (since it’s actually configured to demonstrate distributed tracing as well). Run the following command: kustomize build ./deployment | kubectl apply -f -
Refer to the following codebase for full Golang codebase (just within the folder) - https://github.com/hairizuanbinnoorazman/Go_Programming/blob/master/Web/fullObservability/main.go
A successful deployment? #
When everything from above is successful installed on the cluster, we can run the make access-grafana from the following folder: https://github.com/hairizuanbinnoorazman/Go_Programming/tree/master/Environment/kubernetes. This would set up a forward proxy for an unexposed Kubernetes service which we can access from our local workstation via port 3000.
With that, we can attempt to make a simple pprof dashboard with the above setup and it’ll probably look like the following:
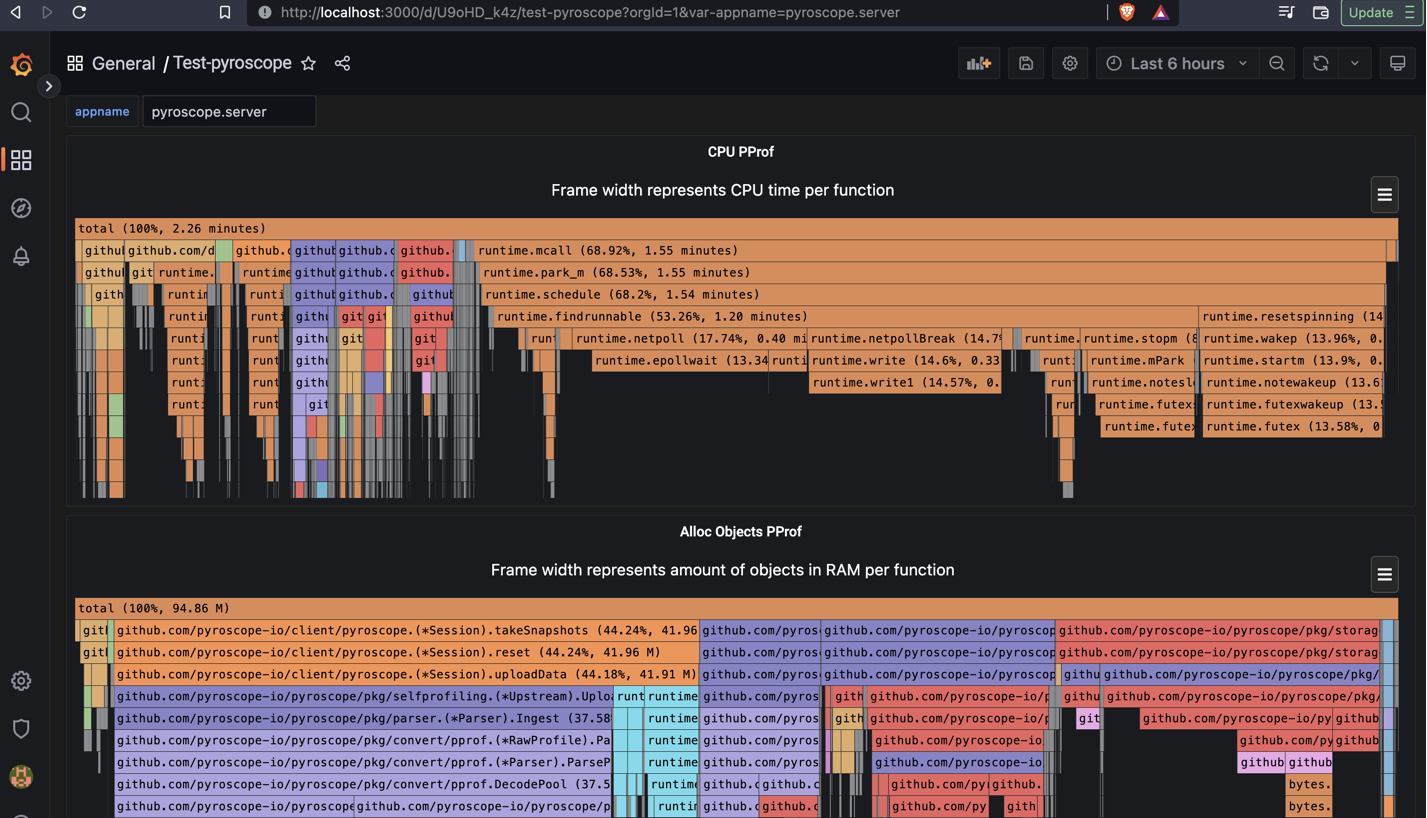
For the pyroscope server itself - the pprof profiles would look like this:
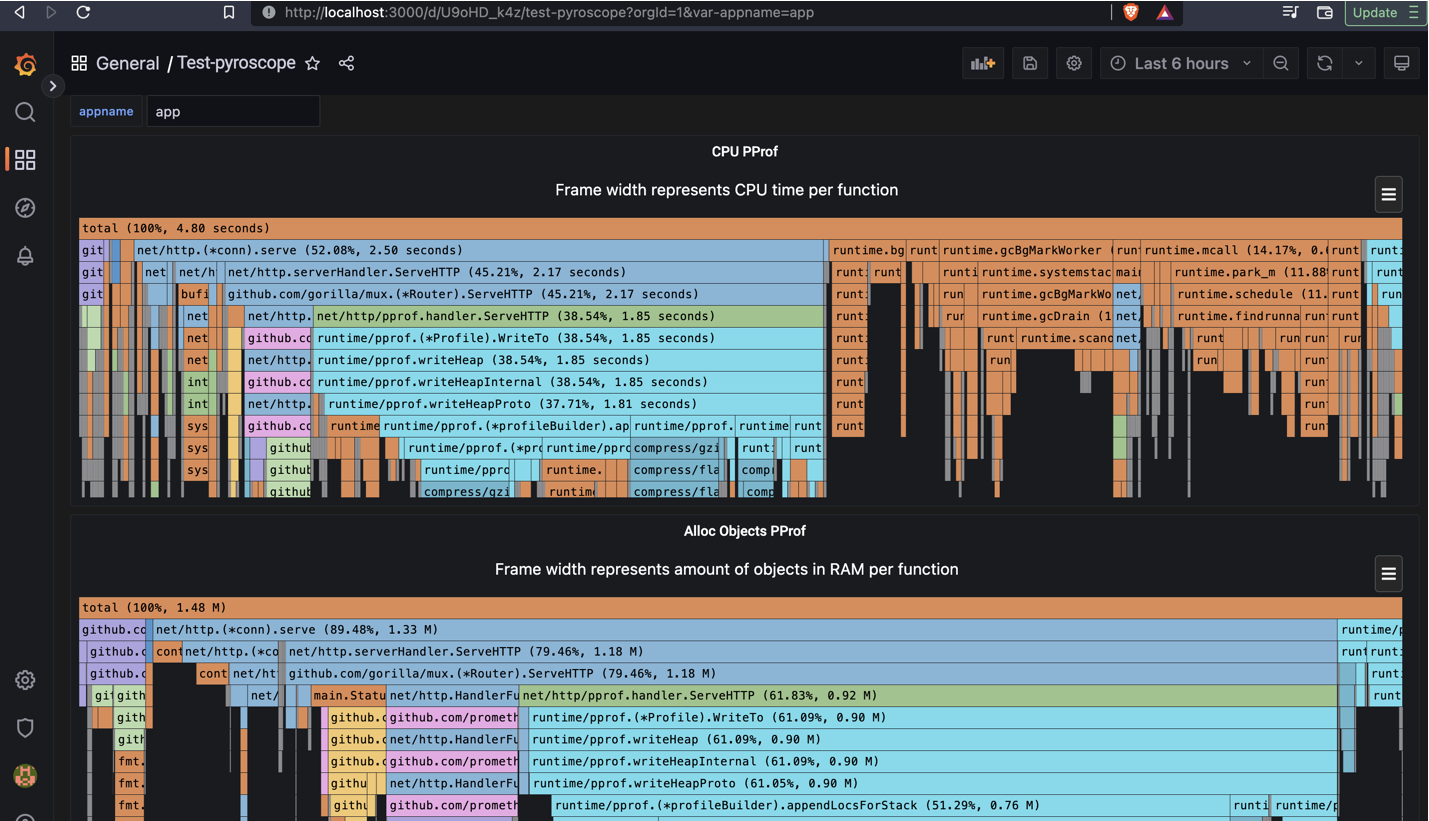
For the app itself - the pprof profiles would look like this:
The following was manually created (will look to add it as a dashboard in the future)
Some observations #
These are some personal takeaways as I attempted to try the following test to get Pyroscope working:
- Need to fix versions of all helm charts to be installed. While attempting to run this, realized that all helm charts being installed for purpose of the observability environment is outdated and the newer helm charts are unable to work with past configurations
- Apparently, there seems to be no way to list applications available for viewing in the dashboard. The pictures shown above with configurable
appnameat the top is merely a hack - the value is obtained via query but by the user manually typing it in and then, the dashboard merely appending that variable to draw all of the said profiles. Hopefully this janked hack will be resolved in the future although this is still a workable solution now. - The
kube-prometheus-stackis not as flexible as I thought; certain features that I need such as the plugins for Pyroscope seems to be hard to injected in - and hence, I had to disable it in that chart and install a separate Grafana dashboard for it