IMPORTANT:
THE FOLLOWING BLOG POST IS OUTDATED. THERE IS AN UPDATE TO GOOGLESLIDES API WHICH DISABLE USAGE OF GOOGLE DRIVE IMAGES. NOW ALL IMAGES HAS TO BE FROM PUBLIC SOURCES. THERE IS A FEATURE REQUEST TICKET CREATED TO ADD THIS FUNCTIONALITY BACK BUT THERE IS A HIGH LIKELIHOOD IT WONT BE BACK FOR A LONG TIME
ALSO, A NEW PUBLIC GOOGLEDRIVE PACKAGE IS AVAILABLE FOR USE - PLEASE USE THAT ONE INSTEAD FOR UPLOADING ANY ASSETS
REFER TO THE FOLLOWING TICKET:
https://github.com/hairizuanbinnoorazman/rgoogleslides/issues/28
Let’s say you’re an analyst and you want to automate your workflow to send your analysis into Googleslides without much involvement from your part; what would you do?
Well, its now possible by using a combination of the googledrive R package as well as the rgoogleslides package.
With the v0.2.0-alpha release, the rgoogleslides package now supports a function to retrieve an image from a user’s own Googledrive and puts it into the slides. (The Googleslides API only accept hosted images; it doesn’t accept an actual png or jpeg files)
Installing the googledrive and rgoogleslides packages. The 2 packages are not yet available cran but I intend to push it there soon. :D. But in the mean time, this is how you would install the packages:
install.packages("devtools")
library(devtools)

# Install the rgoogleslides R package from the master branch
devtools::install_github("sparklineanalytics/rgoogleslides", build_vignettes = TRUE)

# Install the googledrive R package from the master branch
devtools::install_github("hairizuanbinnoorazman/googledrive", build_vignettes = TRUE)
Let’s see how we can get started:
# Analysis on IRIS dataset
library(ggplot2)
library(googledrive)
library(rgoogleslides)
library(png)

# Authorization functions
googledrive::authorize()
rgoogleslides::authorize()
First, we’ll import all the required analysis. We will be performing an analysis on the iris dataset by using the ggplot2 R package. The ggplot2 R package would generate a graph for us to present our analysis but in this use case, we won’t be doing anything too complex.
The Authorization functions would be slightly different from how you would use R functions normally. In order to have some sort of common interface for using the packages, the authorization functions are named with the same name: authorize().
However, this comes with its own problems where if you import both the googledrive and rgoogleslides library, the two functions would cause R to be confused on which one to use. Having the the
The authorize function is similar to the RGA’s authorize function where you can input your own client id and client secret but that would be a blog post for another time.
# Do up a quick plot on iris dataset
first_plot <- qplot(iris$Sepal.Length, iris$Sepal.Width, color = iris$Species)
ggsave("first_plot.png", first_plot)

# Determine the dimensions of the image
image <- png::readPNG("first_plot.png")
dimension <- dim(image)
image_width <- dimension[1]/8 # Calculate to your requirements
image_height <- dimension[2]/8 # Calculate to your requirements

# Upload image to Google drive
id <- googledrive::upload_file("first_plot.png")

# Retrieve the image_id allocated to the image by Google drive
image_id <- id$id
We would then create the plot that we need on the iris dataset and save it locally first before pushing it to be hosted on Google drive.
An important thing to note is to obtain the image width and image height. We would need to use those for calculating the position of the image on the slide. You will see this in action in the next code snippet.
The final portion is to save the image id into a variable so that we can reference it later.
# Create a new googleslides presentation
slide_id <- rgoogleslides::create_slides("Test Analysis")
slide_details <- rgoogleslides::get_slides_properties(slide_id)

# Obtain the slide page that the image is to be added to
slide_page_id <- slide_details$slides$objectId

# Get the position details of the element on the slide
page_element <- rgoogleslides::aligned_page_element_property(slide_page_id,
 image_height = image_height,
 image_width = image_width)
request <- rgoogleslides::add_create_image_request(url = image_id, page_element_property = page_element)
response <- rgoogleslides::commit_to_slides(slide_id, request)
This is where the magic would happen.
We would first create a blank slides presentation for this test and then retrieve the details of the slides. We would need to get the id of the page on the Googleslide which we will editing.
(Note: I realize that normal conventions of how people talk about slides is kind of vague. Some call it deck; others call it slides; When attempting to one of the slide in the slides/deck, we would refer it as a slide which makes it really really confusing here.
So, rather than sticking to that, we would refer to a “slide” in the slides/deck as a page instead so that we can all differentiate and know what is being mentioned here)
We would create a page element which dictates on the position and transformation that we will impacting on the element that is being added to the page on the slide (in this case, it would be an image)
Here, we will feed in the image id which it would then internally construct the required url for the Google Slides API to consume and present the image.
The final slides would kind of look like this:
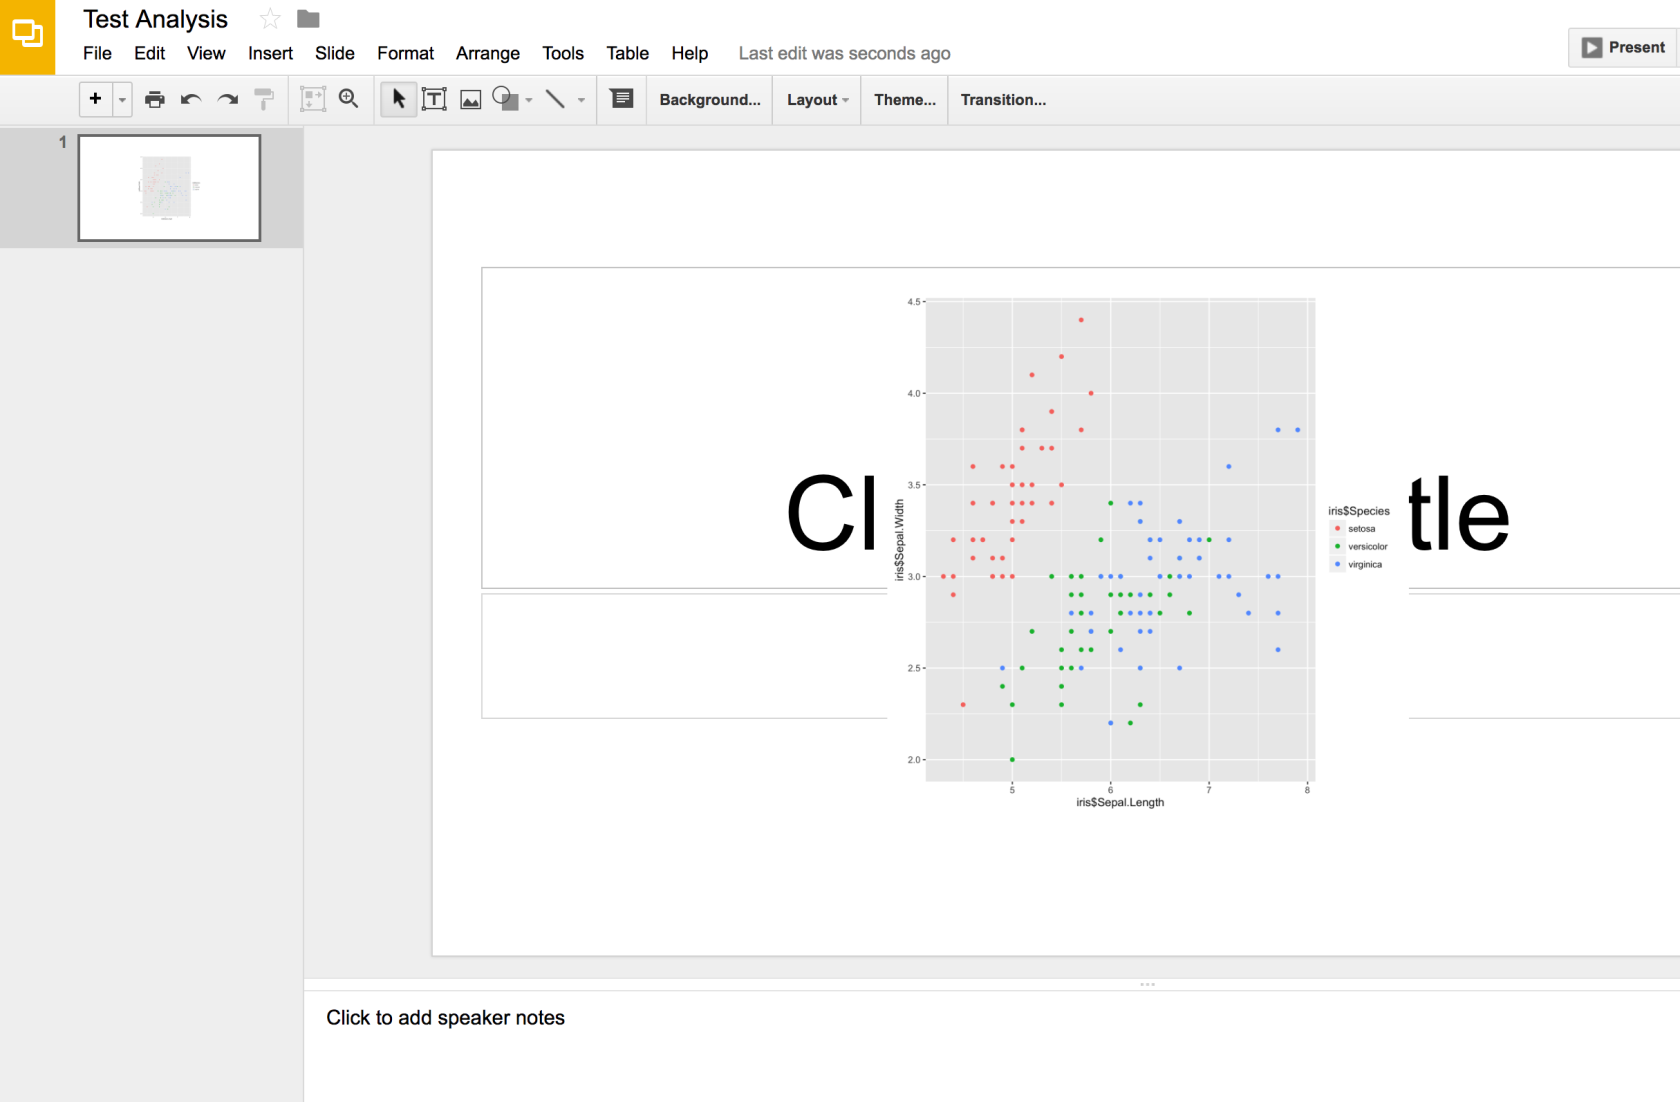
There may be a bit of fine tuning and fixes that both packages require but this is a potential use case of how the packages would interoperate with each other.
Here is to the full script for your convenience:
# Analysis on IRIS dataset
library(ggplot2)
library(googledrive)
library(rgoogleslides)
library(png)

# Authorization functions
googledrive::authorize()
rgoogleslides::authorize()

# Do up a quick plot on iris dataset
first_plot <- qplot(iris$Sepal.Length, iris$Sepal.Width, color = iris$Species)
ggsave("first_plot.png", first_plot)

# Determine the dimensions of the image
image <- png::readPNG("first_plot.png")
dimension <- dim(image)
image_width <- dimension[1]/8
image_height <- dimension[2]/8

# Upload image to Google drive
id <- googledrive::upload_file("first_plot.png")
image_id <- id$id

# Create a new googleslides presentation
slide_id <- rgoogleslides::create_slides("Test Analysis")
slide_details <- rgoogleslides::get_slides_properties(slide_id)

# Obtain the slide page that the image is to be added to
slide_page_id <- slide_details$slides$objectId

# Get the position details of the element on the slide
page_element <- rgoogleslides::aligned_page_element_property(slide_page_id,
image_height = image_height,
image_width = image_width)
request <- rgoogleslides::add_create_image_request(url = image_id, page_element_property = page_element)
response <- rgoogleslides::commit_to_slides(slide_id, request)
There are still some weird issues where after a duration of time, the script will start throwing authentication errors but after refreshing the token and rerunning the script from top to bottom, the script becomes runnable once more. These fixes will be done up in the future.
Expect more features and functions to come to both packages!! Check the progress with the following links:
rgoogleslides: https://github.com/hairizuanbinnoorazman/rgoogleslides
googledrive: https://github.com/hairizuanbinnoorazman/googledrive