Generally, most cloud providers come along with all the observability tooling that you need for your apps built-in with the platform. Some of the common observability tools such as logging, monitoring and nowadays, distributed tracing are usually made available and you can easily use said tools by reading up on the various documentation of how to setup each of these tooling. E.g. if your application is inside a virtual machine and if you need collect metrics and logs from the application, you may need to install an agent in the said VM. The agent would collect those information and send it to the centralized observability tooling in the cloud provider where the information would be provided to you via a UI. Most of the time, these tools are charged based on the amount of logs/metrics you generate from the application (so the less logs/metrics you generate, the cheaper it is monitor your application - a very understanable/reasonable situation). In cases where if your application runs in Kubernetes, maybe the cluster comes with agents pre-installed, making it easier to make use of the logging/metrics/distributed tracing that the cloud provider has.
However, let’s say if you were in a “baremetal” kind of deployment; essentially your applications are not being deployed onto a cloud provider. How would one handle it? What are some of the alternatives/common ways to get such capabilities to be part of your deployment setup?
In this post, I would aim to cover deployment of a logging, metrics as well as distributed tracing in a Kubernetes cluster. Probably, in another blog post, I would then cover how a user would be able to view logs/metrics/traces on such a deployment. (Note: The application needs to be “instrumented” to be able to collect such information)
To follow along the setup here, you can view the following folder in this repo:
https://github.com/hairizuanbinnoorazman/Go_Programming/tree/master/Environment/kubernetes
There are various ways to install such components on Kubernetes. The direct way is to set create the Kubernetes manifests and directly apply it on the cluster via kubectl apply -f <file names>. However, it can be kind of a hassle to do so for many manifest files where there are many repeated variables (e.g. namespace, labels etc). That is where other templating projects come up to solve to make it easy to “template” out said Kubernetes manifest files. One is Kustomize. Another templating tool to deal with installing stuff is Helm. For this post, Helm will be the most that is mostly used here.
For Helm, it is assumed that Helm 3 is being used here. Helm 2 is pretty much outdated and most of the charts out there now mostly have instructions on how to install their respective charts with instructions assuming you have Helm 3.
There may be further updates in the future for the installation of this observabiltiy tools - the updates will go into the codebase mentioned above.
Install Metrics Component #
For metrics, the general common metric server is usually Prometheus. Prometheus collects the metrics data from application by having agents reach out and collect it from specific paths/ports on the application side (this can be customized via Kubernetes annotations etc)
Prometheus comes with its own UI but generally, the Prometheus UI is more “exploratory” work where one explores and tries to understand relationships of how a metric act across time. Generally, people don’t keep exploring metrics just to understand how their application; they would rather have “dashboards” - pre-built charts that showcase the most important information of how their application is performing at that point of time. Prometheus UI is not capable of doing this; rather, it falls to another service, namely Grafana, which provides the graphing/dashboard on top of all these metrics information.
Here are some of Prometheus Helm Charts that can be installed on a cluster:
https://github.com/prometheus-community/helm-charts/tree/main/charts
After installing Helm, you would first need to prep your local environment to be able know of this repository of charts.
helm repo add prometheus-community https://prometheus-community.github.io/helm-chartsYou can then just install the helm chart after doing that. Rather than the helm install subcommand, it would be better to use upgrade --install subcommand with the install flag. The same command can be used to update the installtion on the cluster without switching back and forth between the install and upgrade step. This would make it easier to be put into the script; you can run the script with little worrying that the script only works on “first time” installs etc. It makes it easier to make the script “idempotent”
helm upgrade --install kube-prometheus-stack prometheus-community/kube-prometheus-stackIn the case of the repo that was provided, we need to make certain modifications to fit my usecase. In my usecase, I’m deploying this onto a GKE which uses kubeDNS rather than CoreDNS (CoreDNS seems to be the default in some of the Kubernetes setup if deployed via Ansible kubespray etc). Hence, with that, it would be best to pass in a file to customize the installation to have prometheus monitor KubeDNS rather than CoreDNS (which is the default).
helm upgrade --install -f prom.yaml kube-prometheus-stack prometheus-community/kube-prometheus-stackThe full list of options is available in Charts folder of the respective Chart:
https://github.com/prometheus-community/helm-charts/blob/main/charts/kube-prometheus-stack/values.yaml
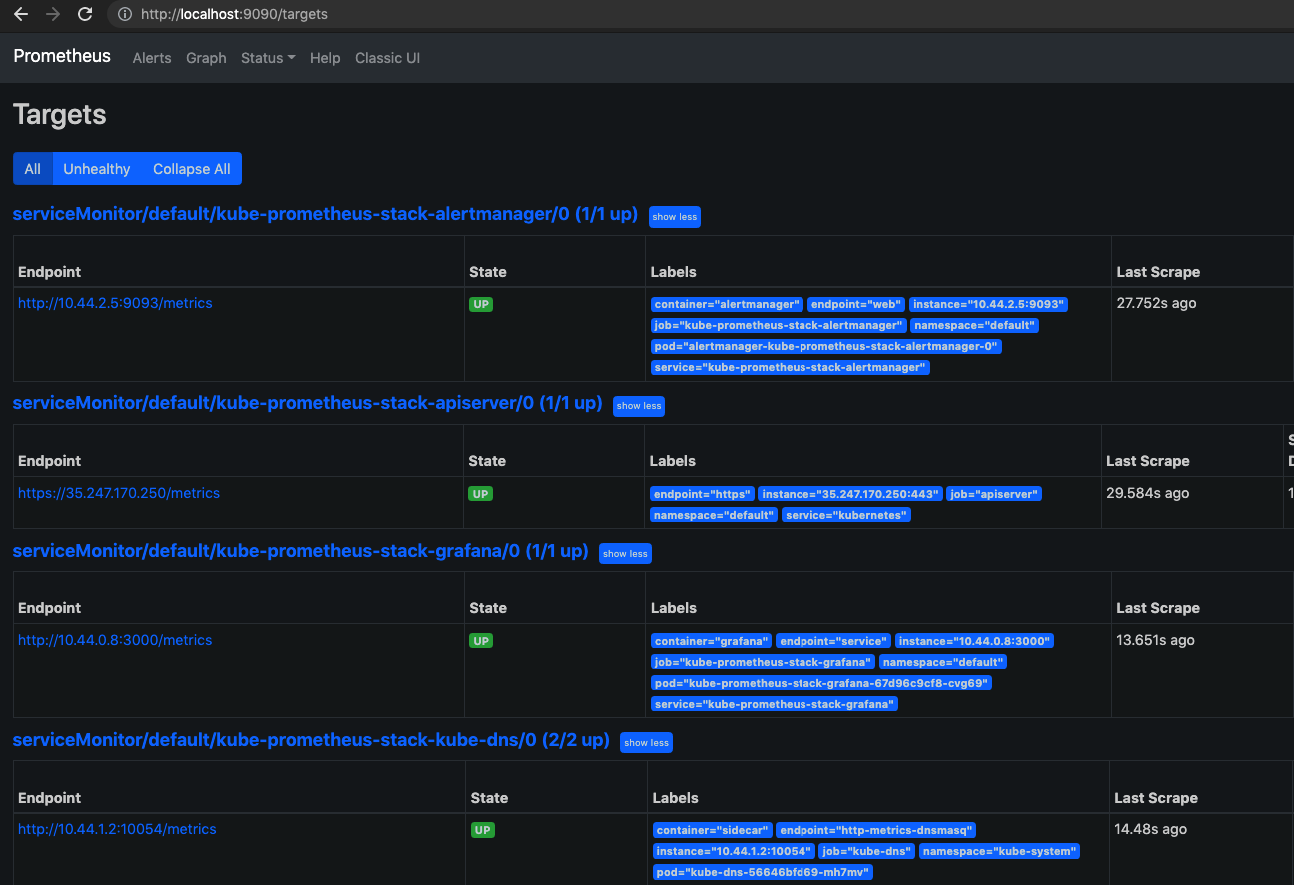
To view Prometheus UI, we can run the following command:
kubectl port-forward service/kube-prometheus-stack-prometheus 9090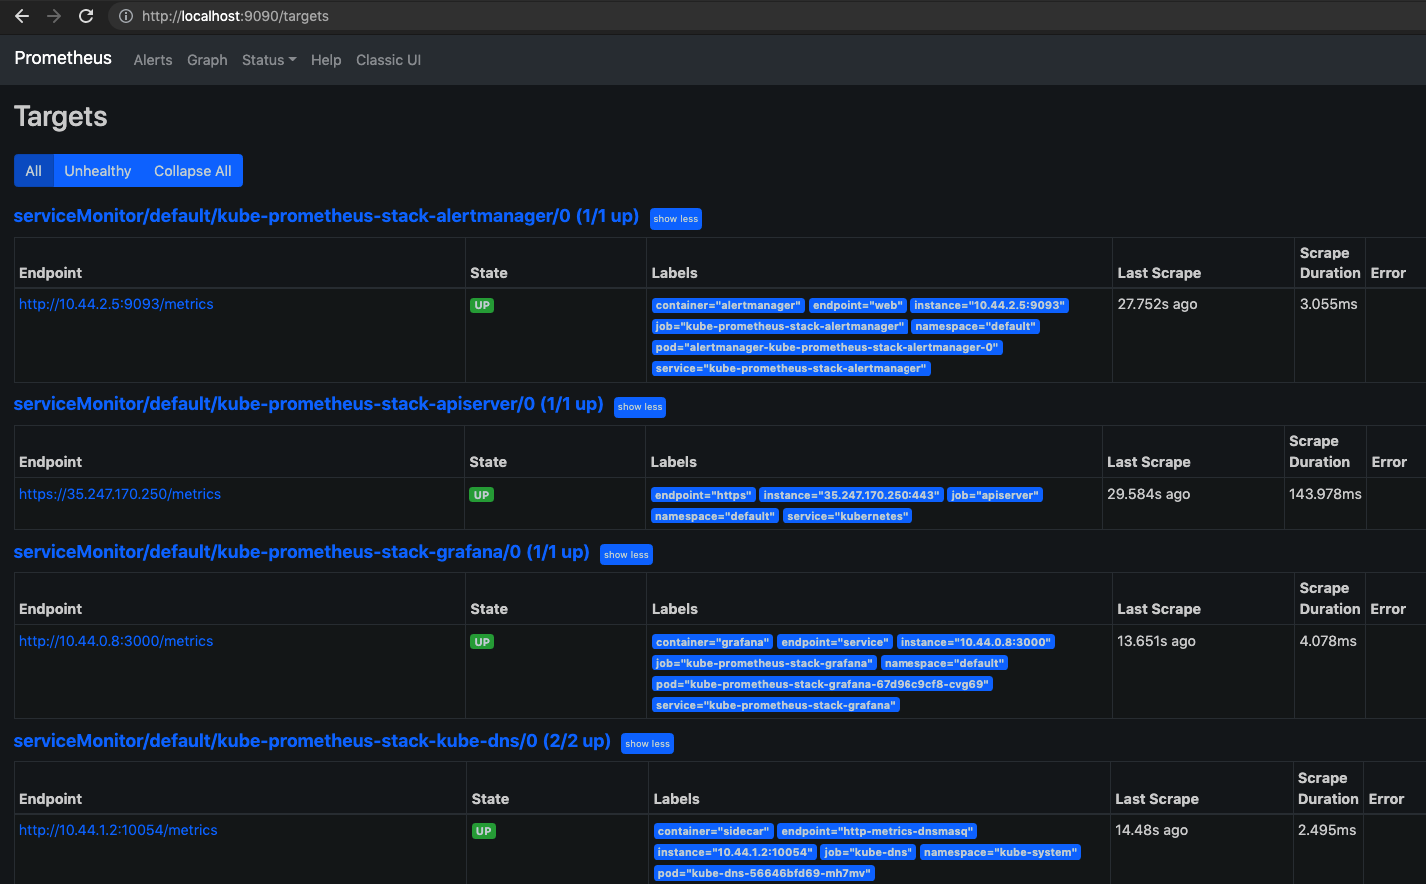
One of the important pages on Prometheus UI is the “targets” page. As much as possible, we would to reduce the number of unhealthy targets
The prometheus stack also deploys a Grafana dashboard as well. We can access it by port-forwarding one of localhost to port 3000 or sth for the Grafana service.
kubectl port-forward service/kube-prometheus-stack-grafana 3000:80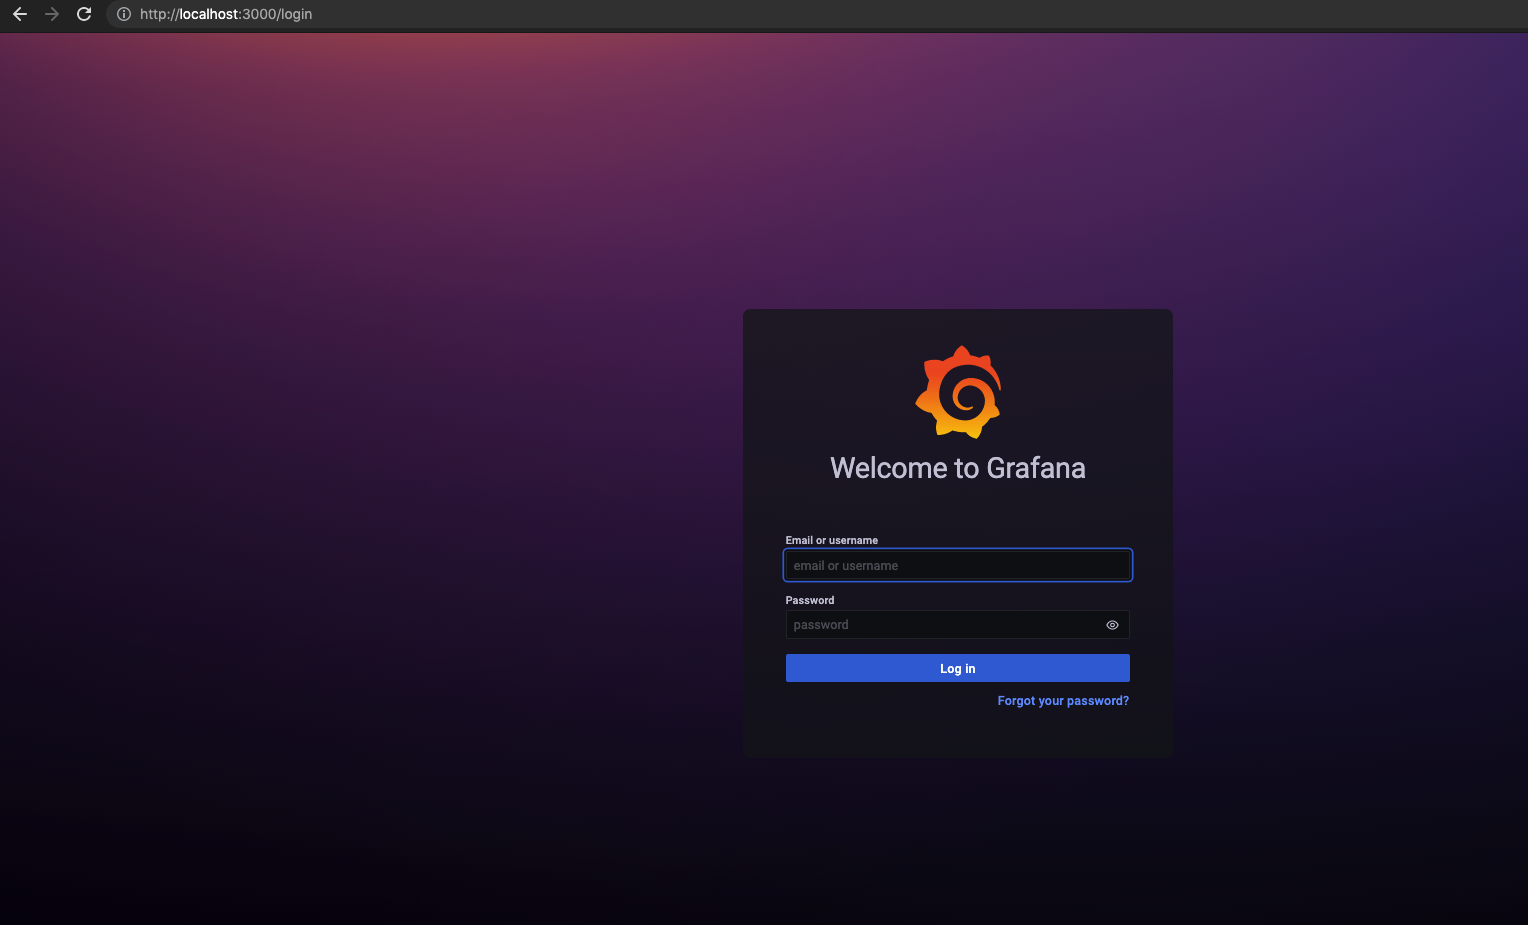
The admin username and password can be found in the following secret: kube-prometheus-stack-grafana. It is actually set in the helm chart - so if you wanted to set a different root/admin password. We can then run the following command to view what is being used to set the username and password.
kubectl get secrets kube-prometheus-stack-grafana -oyamlThe output for the above secret (not the full secret yaml definition) would show this:
apiVersion: v1
data:
  admin-password: cHJvbS1vcGVyYXRvcg==
  admin-user: YWRtaW4=
  ldap-toml: ""
kind: Secret
metadata:
  annotations:
    meta.helm.sh/release-name: kube-prometheus-stack
    meta.helm.sh/release-namespace: default
...
  name: kube-prometheus-stack-grafana
  namespace: default
  resourceVersion: "3410"
  uid: ff19912e-43fd-47c6-a97a-aec8fb687a87
type: Opaque
The username and password looks like gibberish but its just base64 encoded. We can reveal actual values by running the following commands:
echo -n cHJvbS1vcGVyYXRvcg== | base64 --decode
echo -n YWRtaW4= | base64 --decode
Install Objects Storage #
In the case of “bare metal” services that have data that shouldn’t be stored in Cloud Providers, that would mean that we wouldn’t have a “S3” that we can use. S3 provides object storage and is relatively known to be service that provides cheap and durable storage (albeit at the exchange of not being in a filesystem and without all the various filesystem guarantees). In Google Cloud, GCS would be the object storage that would be provided to its customers.
However, what if we don’t have this capability; how should do it?
Well, there is Minio. It provides object storage and is S3 compatible - which kind of means that one can utilize libraries that talks to S3 and switch the endpoints to the Minio deployment and it should still work as expected.
helm upgrade --install minio-operator minio/minio-operatorThere were some weird issues with trying to set up the certs for SSL and hence, I set up minio and turned off requirement for SSL. Also, generally, you can skip SSL for internal traffic but once I figured out the reason why the SSL didn’t work as expected, I would probably adjust the installation of the Minio Object Storage component to have SSL communications.
helm upgrade --install -f minio.yaml minio-operator minio/minio-operatorThe default values yaml file for minio operator:
https://github.com/minio/operator/blob/master/helm/minio-operator/values.yaml
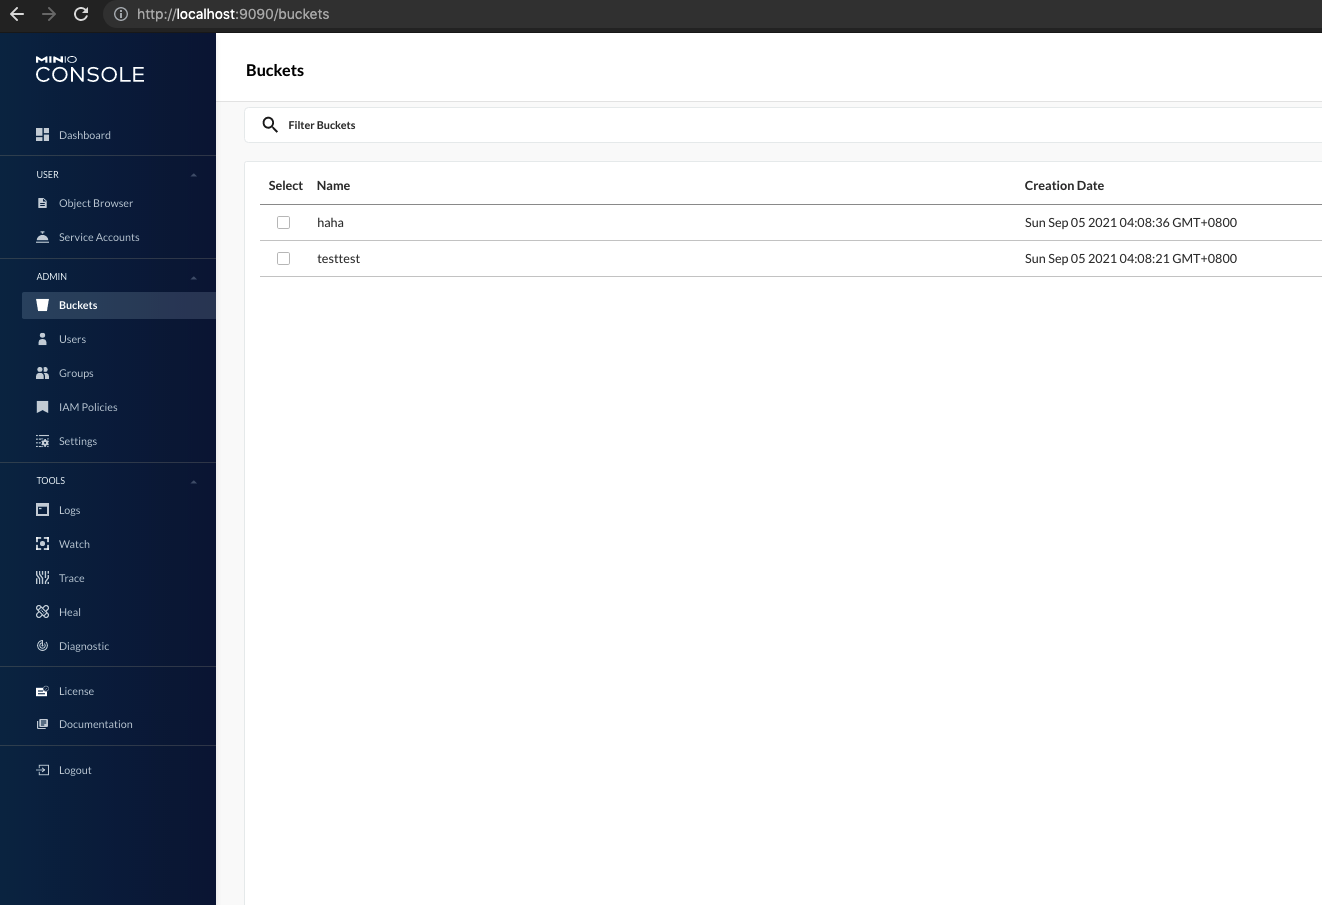
By default, Minio doesn’t come with any initial default buckets. Also, at the same time, it does seem that the Minio Operator Helm chart doesn’t contain any capability to be able provision bucket on initial deploy. Hence, we would need to script this out on our end to create the buckets accordingly.
A simple way would be to utilize the minio/mc image. It contains the mc CLI tool that would interact with the Minio Cluster. The slightly tricky part is to have this image connect to the Minio cluster and this is defined in the following Configmap and Job. The configmap would provide a config.json file that is actually used by the mc cli tool. We would replace the default config.json file - which would then allow us to create the buckets.
apiVersion: v1
kind: ConfigMap
metadata:
  name: mc-config
data:
  config.json: |
    {
      "version": "10",
      "aliases": {
        "yahoo": {
          "url": "http://minio1-hl.default.svc.cluster.local:9000",
          "accessKey": "minio",
          "secretKey": "minio123",
          "api": "s3v4",
          "path": "auto"
        }
      }
    }
---
apiVersion: batch/v1
kind: Job
metadata:
  name: make-bucket-testtest
spec:
  template:
    spec:
      containers:
      - name: mc
        image: minio/mc
        args: ['mb', '--ignore-existing', 'yahoo/testtest']
        # For debugging
        # args: ['admin', 'info', 'yahoo']
        volumeMounts:
          - mountPath: /root/.mc/config.json
            name: mc-config
            subPath: config.json
      restartPolicy: Never
      volumes:
        - configMap:
            defaultMode: 0777
            name: mc-config
          name: mc-config
---
apiVersion: batch/v1
kind: Job
metadata:
  name: make-bucket-haha
spec:
  template:
    spec:
      containers:
      - name: mc
        image: minio/mc
        args: ['mb', '--ignore-existing', 'yahoo/haha']
        # For debugging
        # args: ['admin', 'info', 'yahoo']
        volumeMounts:
          - mountPath: /root/.mc/config.json
            name: mc-config
            subPath: config.json
      restartPolicy: Never
      volumes:
        - configMap:
            defaultMode: 0777
            name: mc-config
          name: mc-config
We can view the Minio UI via the following command:
kubectl port-forward service/minio1-console 9090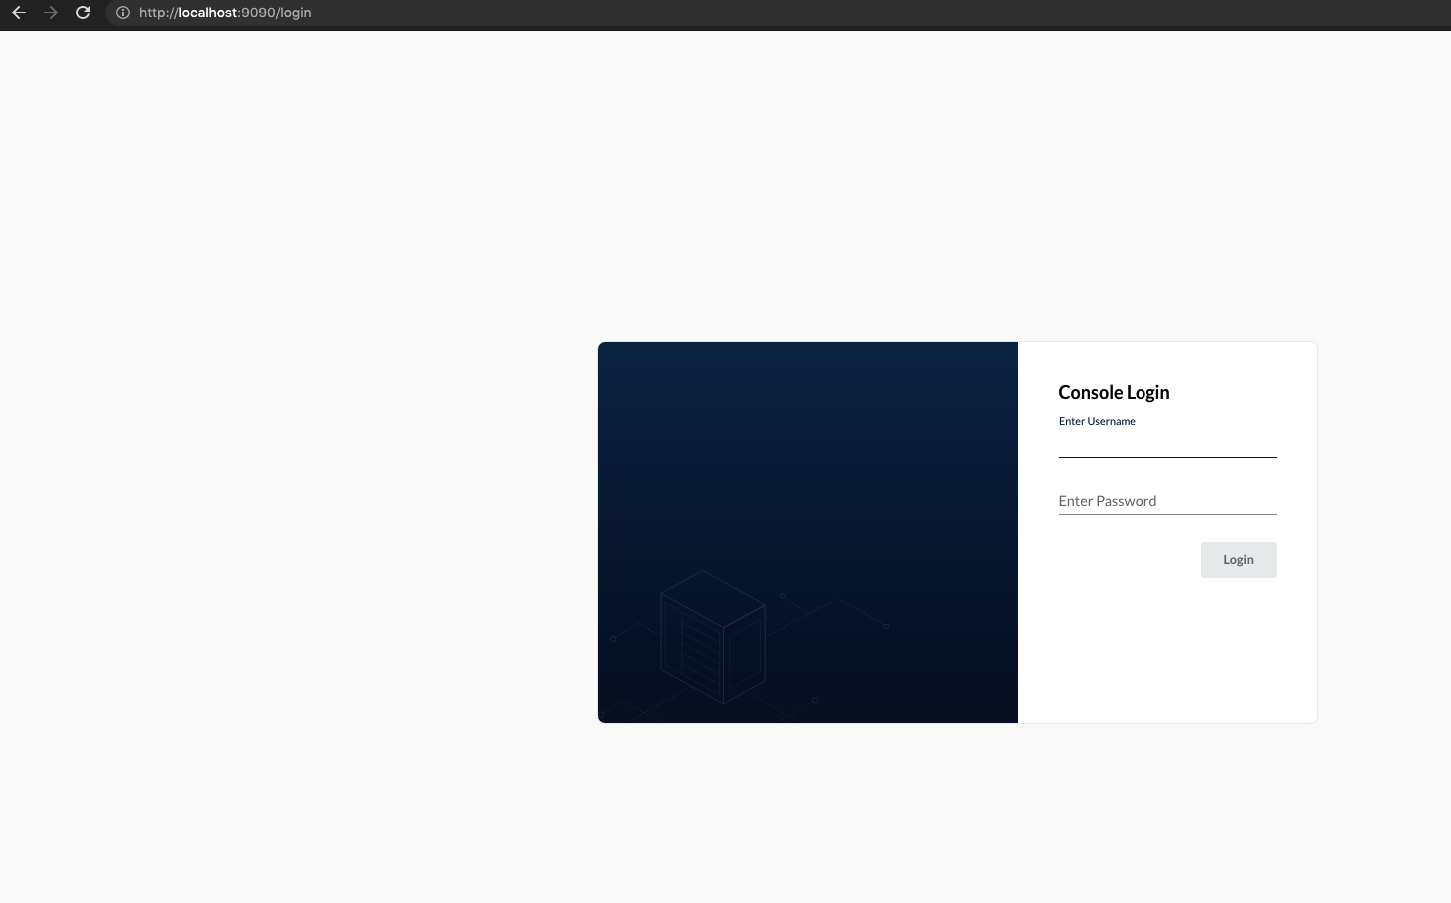
The username and password for this can be found here:
kubectl get secrets minio1-secret -oyaml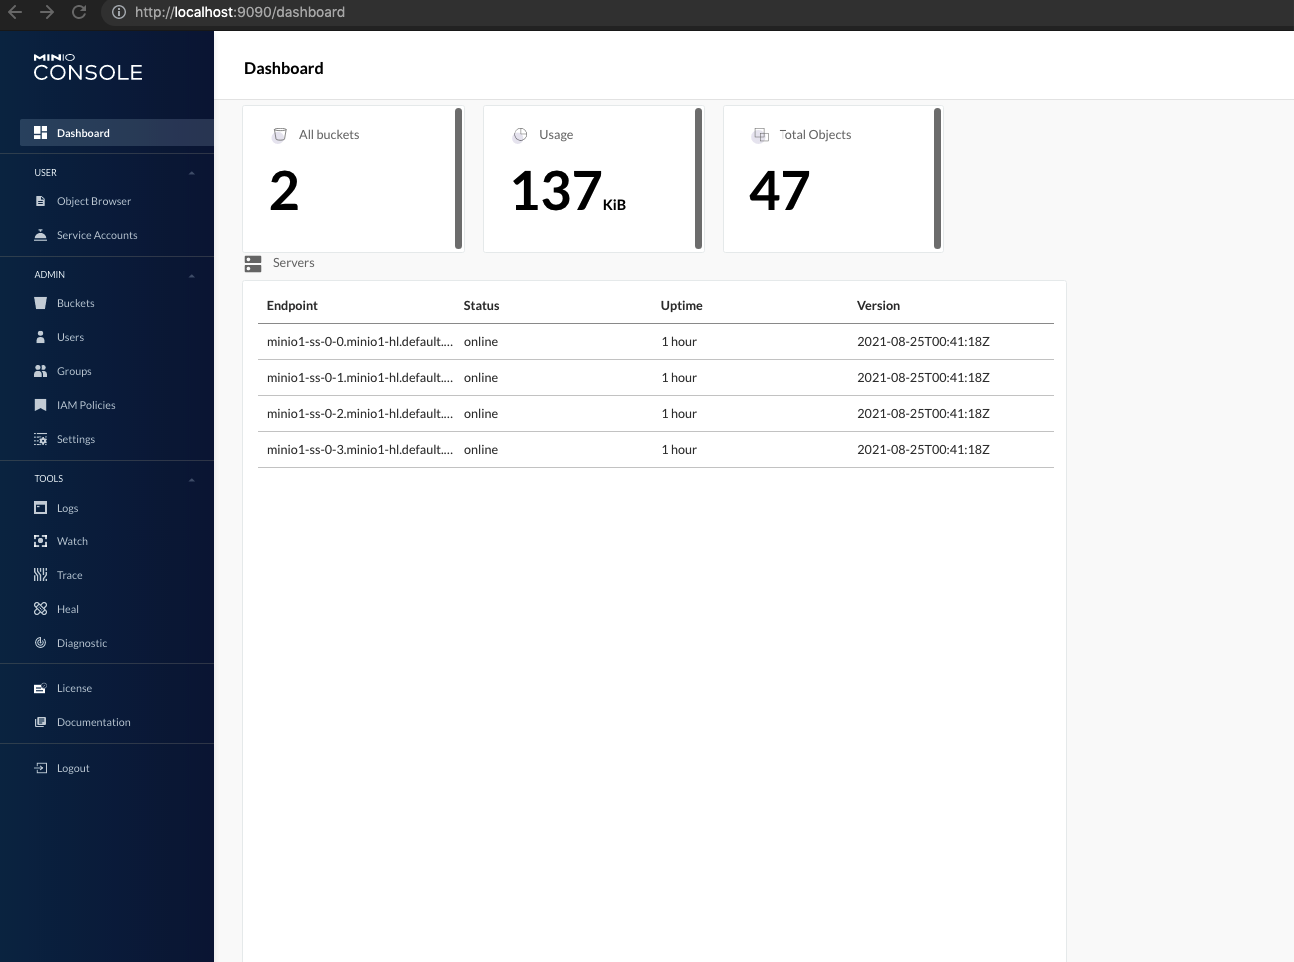
Install Logging Stack #
There is a new player in town when it comes to the logging game. It’s Loki and I believe it is also provided by the same team that provided Grafana and other observability tooling.
In the past, ELK is kind of the hot player when it comes to handling Logging. ELK stands for the Elasticsearch, Logstash and Kibana application stack and the three of them deal with logs pretty decently. Elasticsearch is able to store large copious amounts of data. Logstash serves to the “computation” layer which does filters and other calculations before passing the log over to Elasticsearch. Kibana is the “presentation” layer that would provide the graphing and dashboarding capability to present the logs being captured in Elasticsearch.
The interesting thing about logging, at least in the ELK case, is that you need a large amount of resources to store all that information. Also, considering that we are storing the logs in Elasticsearch; the logs are also being indexed. It makes the logs searchable but it comes at a huge cost - indexes would need to be built for them. The indexes for such large amount of log data is not cheap - if you have GBs of logs data, you can also expect GBs of indexes of the log data. The data is kind of all stored on disk - which makes it pretty expensive to handle.
With Loki, they presented a interesting way to solve this whole logging problem. They have storage code to store the logs into object storage (which is definitely a cheaper way to store the raw log data). The indexes are now storable in its own boltdb database (I believe its customized for its use) or in cassandra database (for a more production-like setup)
I’m not sure how it’ll go but it’ll be interesting to observe whether this solution would play effectively in the future. This might not be the “final answer” for the whole logging situation that companies who can’t rely on Cloud Providers for their observability needs.
To install Loki:
helm repo add grafana https://grafana.github.io/helm-chartsOnce we run the code above, we can then install the helm chart. Either run the next line for the default installation.
helm upgrade --install loki grafana/loki-distributedOr, if we want to customize the installation slightly:
helm upgrade --install -f loki.yaml loki grafana/loki-distributedThe default values file for loki-distributed chart:
https://github.com/grafana/helm-charts/blob/main/charts/loki-distributed/values.yaml
The above would install only Loki - it doesn’t collect logs from the containers in the Kubernetes cluster. The logs can be collected by log collection agents; some examples are filebeat, fluentd and promtail. Since we’re already using Loki, we might as well use a project that is kind of created by the Grafana team - promtail
To install promtail:
helm upgrade --install -f promtail.yaml promtail grafana/promtailThe default values yaml file for promtail is here:
https://github.com/grafana/helm-charts/blob/main/charts/promtail/values.yaml
Install Distributed Tracing Component #
Distributed tracing is one of the newer parts in the observability space. This is partly because the tool is created to solve analyzing the newer software architectures that came up - microservices. With microservices, it makes it extremely hard to understand how request spend bouncing around the various applications in the data centre. The code is instrumented with snippets of code to report incoming/outgoing requests between the microservices to a centralized distributed tracing tool which would then provide vizualizations for us to understand what’s happening under the hood of the apps.
The poster boy for the distributed tracing projects are Zipkin and Jaeger and has been for a couple of years. However, as with the Loki project in its attempts to solve logging by reducing storage requirements, the same can be said for Zipkin and Jaeger. Jaeger kind of depends on databases for storage (namely Cassandra/Elasticsearch). And with those Databases, it is way more resource heavy to manage those - it those more memory and it takes way more storage. Storing distributed traces in S3 would definitely be a nice cheaper alternative if its possible and with that - I can finally mention about Tempo.
The main draw of Tempo here is the capability to store the data on some sort of S3 compatible storage. This allow us to store distributed traces much more cheaply - which also then makes it easier to know go through the choice of whether to do sampling on distributed traces or not. If Storage prices of attempting to store traces goes down enough, then it would be worth to totally keep all traces - which would make that pretty awesome.
Scripting it out #
In the folder, https://github.com/hairizuanbinnoorazman/Go_Programming/tree/master/Environment/kubernetes, it contains a Makefile that would help create the cluster and install the observability tooling at one go.
make environment
make cluster
make observability
The make environment is done to set up Helm repositories. The make cluster is done to create Kubernetes cluster. It is assumed that the gcloud tool is setup properly. The make observability will then setup the tooling such as Prometheus, Minio, Loki, Promtail, Tempo - and all of these metrics/logs/traces are shown on Grafana.