Let’s say we have a set of applications that was designed to be a set of microservices. Each of the applications would generally be designed to be focused on one specific domain and in order to achieve the overall goal of the platform. However,for the platform to work properly, the applications would generally need to work together as one which would involve the application contacting each other.
However, having the applications being distributed in that manner makes it hard to understand the platform as a whole. It becomes difficult to analyze which application is the bottleneck when it comes to the response of some of the web application. Fortunately, there are various tooling nowadays that can help deal with this - one example of this is Jaeger.
The following example takes a set of application that have been deployed onto a Kubernetes platform and try to analyze the dependencies of the application and the breakdown of the timings for the application response. We would need to do the following:
- Create an application that has opentracing libs and functions embedded in it
- Deploy an instance of Jaeger on the Kubernetes
- Have an application that reports to the Jaeger instance in order to allow us to analyze it
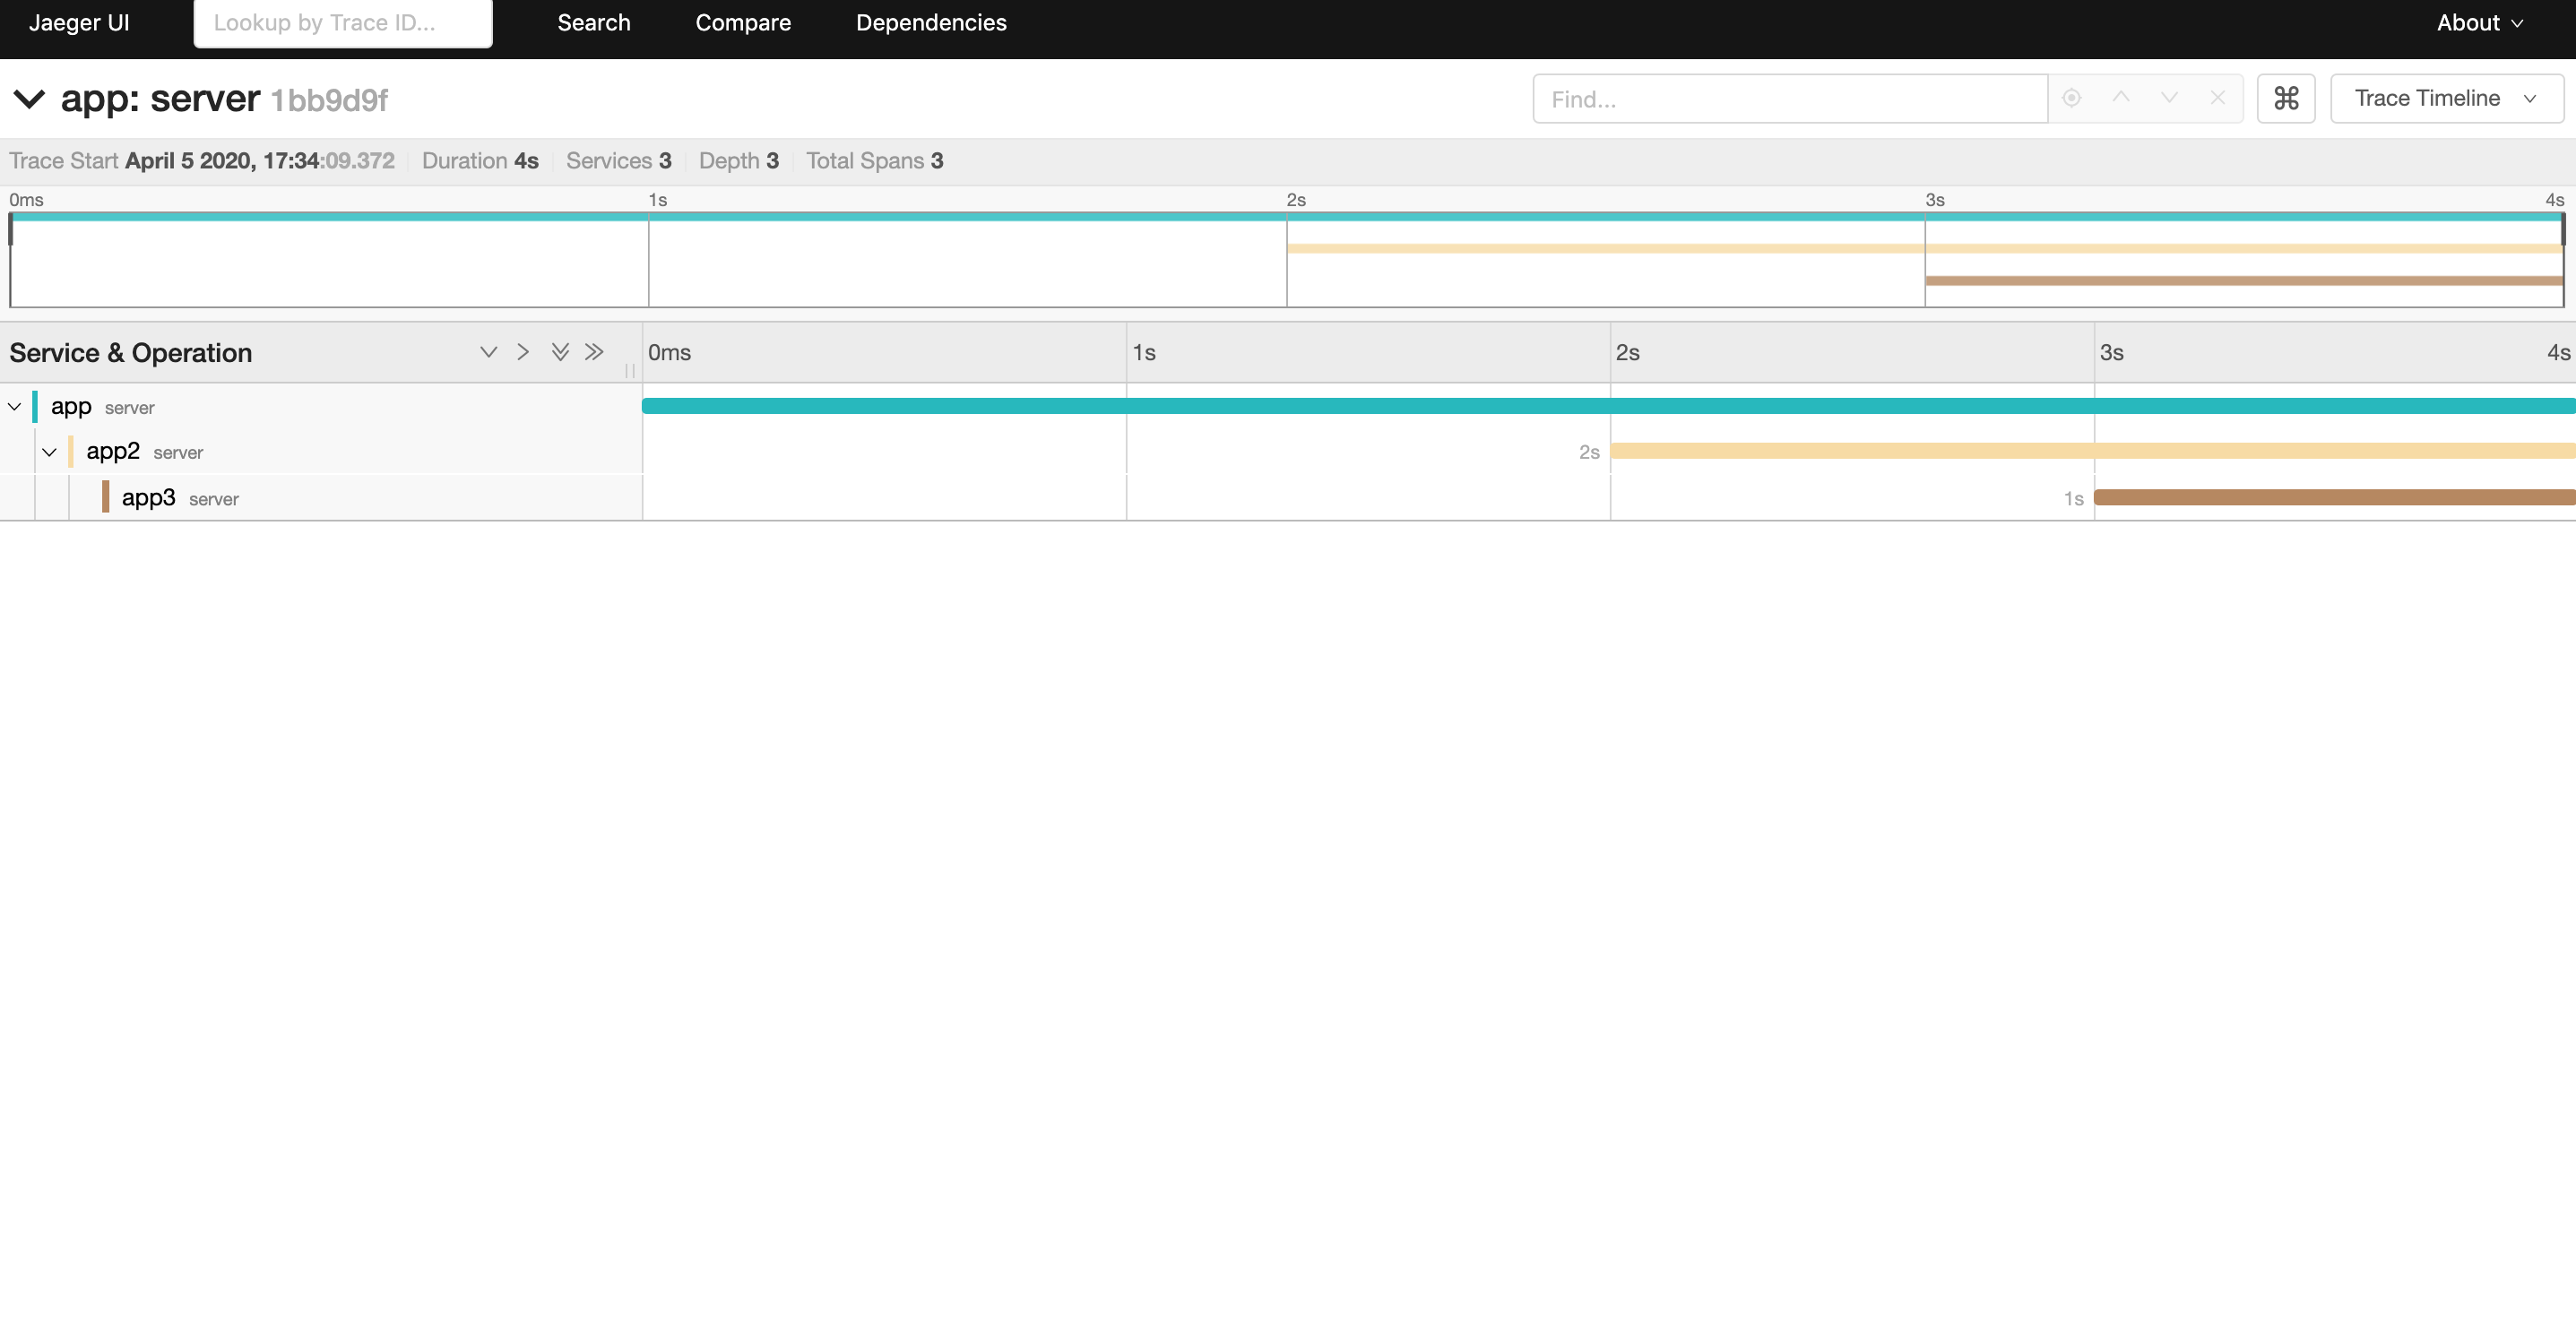
After doing the following steps, we can probably see a dashboard like this:
Developing application with tracing embedded in it #
Although right now there are already efforts in order to attempt to merge open tracing and opencensus standards together to form open telemetry - it’s still going to take a while before the implementation for that comes out in the while. For now, let’s just look at how to understand applications behaviour by using opentracing libraries for it.
The full complete set of examples from current implementations for Golang applications can be viewed here: https://github.com/jaegertracing/jaeger-client-go/blob/master/config/example_test.go
So with that in mind, let’s try to create an example Golang application that allow us to do the following:
- Use Environment Variables to control response times of the application
- Use Environment Variables to control on whether the application should call downstream application
- Use Environment Variables to control what to reply to users that request a response from the service
- Use Environment Variables to control what the service name of the application that is to be shown on Jaeger
- Deploy application onto Kubernetes platform
This would be the result of such requirements (the opentracing library is also introduced here as well)
Out of convenience, we’ll be utilizing the Google Cloud Platform here as an example of a target Kubernetes cluster.
package main

import (
	"fmt"
	"log"
	"net/http"
	"os"
	"strconv"
	"time"

	"github.com/opentracing/opentracing-go"
	"github.com/opentracing/opentracing-go/ext"
	"github.com/uber/jaeger-client-go"
	jaegercfg "github.com/uber/jaeger-client-go/config"
	jaegerlog "github.com/uber/jaeger-client-go/log"
	"github.com/uber/jaeger-lib/metrics"
)

func handler(w http.ResponseWriter, r *http.Request) {
	tracer := opentracing.GlobalTracer()
	spanCtx, _ := tracer.Extract(opentracing.HTTPHeaders, opentracing.HTTPHeadersCarrier(r.Header))
	serverSpan := tracer.StartSpan("server", ext.RPCServerOption(spanCtx))
	defer serverSpan.Finish()

	log.Print("Hello world received a request.")
	defer log.Print("End hello world request")
	target := os.Getenv("TARGET")
	if target == "" {
		target = "NOT SPECIFIED"
	}
	waitTimeEnv := os.Getenv("WAIT_TIME")
	waitTime, _ := strconv.Atoi(waitTimeEnv)
	log.Printf("Sleeping for %v", waitTime)
	time.Sleep(time.Duration(waitTime) * time.Second)
	fmt.Fprintf(w, "Hello: %s!\n", target)

	clientURL := os.Getenv("CLIENT_URL")
	if clientURL != "" {
		url := clientURL
		req, _ := http.NewRequest("GET", url, nil)

		ext.SpanKindRPCClient.Set(serverSpan)
		ext.HTTPUrl.Set(serverSpan, url)
		ext.HTTPMethod.Set(serverSpan, "GET")

		tracer.Inject(serverSpan.Context(), opentracing.HTTPHeaders, opentracing.HTTPHeadersCarrier(req.Header))
		http.DefaultClient.Do(req)
	}
}

func main() {
	log.Print("Hello world sample started.")

	jaegerCollector := os.Getenv("JAEGER_COLLECTOR")
    // It just so happens then we would call our jaeger instance simplest.
    // And it would create a service endpoint called simplest-collector which we can sends our traces/spans to
    if jaegerCollector == "" {
		jaegerCollector = "http://simplest-collector:14268/api/traces"
	}

	cfg := jaegercfg.Configuration{
		Sampler: &jaegercfg.SamplerConfig{
			Type:  jaeger.SamplerTypeConst,
			Param: 1,
		},
		Reporter: &jaegercfg.ReporterConfig{
			CollectorEndpoint: jaegerCollector,
			LogSpans:          true,
		},
	}

	jLogger := jaegerlog.StdLogger
	jMetricsFactory := metrics.NullFactory

	serviceName := os.Getenv("SERVICE_NAME")
	if serviceName == "" {
		serviceName = "NOT SPECIFIED"
	}

	// Initialize tracer with a logger and a metrics factory
	closer, _ := cfg.InitGlobalTracer(
		serviceName,
		jaegercfg.Logger(jLogger),
		jaegercfg.Metrics(jMetricsFactory),
	)
	defer closer.Close()

	http.HandleFunc("/", handler)
	http.ListenAndServe(":8080", nil)
}
This would be the dockerfile for it
# Example of golang module name: github.com/sampleusernameongithub/basicWithTracing
# And with that example - name of binary that would be built: basicWithTracing
FROM golang
ADD . /go/src/<INSERT GOLANG MODULE NAME HERE>
WORKDIR /go/src/<INSERT GOLANG MODULE NAME HERE>
RUN go get
RUN go install <INSERT GOLANG MODULE NAME HERE>
ENTRYPOINT ["/go/bin/<NAME OF BINARY>"]
EXPOSE 8080
And with that, we can run the following set of commands:
docker build -t gcr.io/<GCP PROJECT ID>/basicwithtracing:v1 .
docker push gcr.io/<GCP PROJECT ID>/basicwithtracing:v1
This would have a container that we can pull into GKE for us to test
Deploy Jaeger #
There are various ways to deploy Jaeger instances. However, current more modern ways would be deploy a Jaeger operator - where we would have some sort of controller application deployed on a cluster which would would provide a “Jaeger” resource on our cluster. Any user can then request for a Jaeger resource.
We can deploy such a Jaeger operator via helm chart. (We would need to install helm first though)
kubectl -n kube-system create serviceaccount tiller
kubectl create clusterrolebinding tiller \
  --clusterrole cluster-admin \
  --serviceaccount=kube-system:tiller
helm init --service-account tiller

helm repo add jaegertracing https://jaegertracing.github.io/helm-charts
helm install --name my-release jaegertracing/jaeger-operator
We can then create the following Jaeger resource
# Saved as jaeger.yaml
apiVersion: jaegertracing.io/v1
kind: Jaeger
metadata:
  name: simplest
Run the command: kubectl apply -f jaeger.yaml
And with that we should see the following if we run kubectl get pods
NAME                                          READY   STATUS    RESTARTS   AGE
my-release-jaeger-operator-6879c898c6-8lxvv   1/1     Running   0          1h
simplest-569dc8589b-8xjjl                     1/1     Running   0          1h
The following should be deployed in the “default” namespace - unless your default namespace is not “default”
And we would see this if we have run kubectl get svc
NAME                                 TYPE        CLUSTER-IP    EXTERNAL-IP   PORT(S)                                  AGE
kubernetes                           ClusterIP   10.8.0.1      <none>        443/TCP                                  2h
my-release-jaeger-operator-metrics   ClusterIP   10.8.1.111    <none>        8383/TCP,8686/TCP                        1h
simplest-agent                       ClusterIP   None          <none>        5775/UDP,5778/TCP,6831/UDP,6832/UDP      1h
simplest-collector                   ClusterIP   10.8.1.210    <none>        9411/TCP,14250/TCP,14267/TCP,14268/TCP   1h
simplest-collector-headless          ClusterIP   None          <none>        9411/TCP,14250/TCP,14267/TCP,14268/TCP   1h
simplest-query                       ClusterIP   10.8.9.49     <none>        16686/TCP                                1h
Note the simplest-query as well as simplest-collector -> we would send our traces/spans to the simplest-collector and then we can view the results from those via simplest-query service endpoint.
Testing the whole thing out #
We can now have the following yaml that deploys 3 of the same apps - with different configurations. The different configurations would somewhat reveal the dependecies of the services like the graph above
apiVersion: extensions/v1beta1
kind: Deployment
metadata:
  labels:
    run: app
  name: app
  namespace: default
spec:
  progressDeadlineSeconds: 600
  replicas: 1
  revisionHistoryLimit: 10
  strategy:
    rollingUpdate:
      maxSurge: 25%
      maxUnavailable: 25%
    type: RollingUpdate
  template:
    metadata:
      labels:
        run: app
    spec:
      containers:
        - image: gcr.io/<GCP PROJECT ID>/basicwithtracing:v1
          imagePullPolicy: Always
          name: app
          env:
            - name: WAIT_TIME
              value: "2"
            - name: TARGET
              value: "MIAO"
            - name: SERVICE_NAME
              value: app
            - name: CLIENT_URL
              value: "http://app2:8080"
      dnsPolicy: ClusterFirst
      restartPolicy: Always
---
apiVersion: extensions/v1beta1
kind: Deployment
metadata:
  labels:
    run: app2
  name: app2
  namespace: default
spec:
  progressDeadlineSeconds: 600
  replicas: 1
  revisionHistoryLimit: 10
  strategy:
    rollingUpdate:
      maxSurge: 25%
      maxUnavailable: 25%
    type: RollingUpdate
  template:
    metadata:
      labels:
        run: app2
    spec:
      containers:
        - image: gcr.io/<GCP PROJECT ID>/basicwithtracing:v1
          imagePullPolicy: Always
          name: app2
          env:
            - name: WAIT_TIME
              value: "1"
            - name: TARGET
              value: "MIAO"
            - name: SERVICE_NAME
              value: app2
            - name: CLIENT_URL
              value: "http://app3:8080"
      dnsPolicy: ClusterFirst
      restartPolicy: Always
---
apiVersion: v1
kind: Service
metadata:
  labels:
    run: app2
  name: app2
spec:
  ports:
    - port: 8080
      protocol: TCP
      targetPort: 8080
  selector:
    run: app2
  type: ClusterIP
---
apiVersion: extensions/v1beta1
kind: Deployment
metadata:
  labels:
    run: app3
  name: app3
  namespace: default
spec:
  progressDeadlineSeconds: 600
  replicas: 1
  revisionHistoryLimit: 10
  strategy:
    rollingUpdate:
      maxSurge: 25%
      maxUnavailable: 25%
    type: RollingUpdate
  template:
    metadata:
      labels:
        run: app3
    spec:
      containers:
        - image: gcr.io/<GCP PROJECT ID>/basicwithtracing:v1
          imagePullPolicy: Always
          name: app3
          env:
            - name: WAIT_TIME
              value: "1"
            - name: TARGET
              value: "MIAO"
            - name: SERVICE_NAME
              value: app3
      dnsPolicy: ClusterFirst
      restartPolicy: Always
---
apiVersion: v1
kind: Service
metadata:
  labels:
    run: app3
  name: app3
spec:
  ports:
    - port: 8080
      protocol: TCP
      targetPort: 8080
  selector:
    run: app3
  type: ClusterIP
These would deploy 3 deployments - app, app2 and app3. app2 and app3 are exposed and allow other pods in the cluster to contact it via service names -> see the CLIENT_URL environment config in the deployment yaml file above.
In order to test and see such an analysis, we would need to do the following:
- Go into one of the
apppods and ping the localhost:8080 resource - Port forward the
simplest-queryservice to localhost in order to view the dashboard
# Run to get pod name to enter into
kubectl get pods

# Run this to get into the bash of one of app's pods in order to run curl commands etc
kubectl exec -it <pod name> /bin/bash

# Run this within the pod in order to begin the cascading request and send responses to Jaeger
curl localhost:8080
To view the dashboard, we would need to run the following:
kubectl port-forward service/simplest-query 8088:16686This forwards the 16686 port of simplest-query to the localhost computer port 8088. Going into localhost:8088 on local computer would allow us to see the Jaeger dashboard